Oceanographic Links to Alexandrium-imposed
Toxicity in the Gulf of Maine
| Funded by: |
NOAA, Coastal Ocean Program |
| Principal Investigator: |
Andrew Thomas |
| Co-Principal Investigator: |
H. Xue
School of Marine Sciences, University of Maine |
PROJECT SUMMARY:
This is a data mining project based on remote sensing,
numerical modeling and statistical analyses that will
identify and quantify links between coastal toxicity
caused by Alexandrium in the Gulf of Maine and oceanic
variability. The Maine Department of Marine Resources (DMR)
monitors toxin levels in multiple species of shellfish
at over 300 Maine coastal sites throughout non-winter
months. The same sites and/or species are not
necessarily sampled each time. Nevertheless, over 25
years of these data provide an unparalleled
documentation of HAB variability along the Maine coast
and our best window into the interannual variability of
Alexandrium dynamics. Annual in situ surveys of
potentially relevant oceanographic characteristics to
compare with the DMR record are not available. Three
sources of data do provide systematic and consistent
metrics of oceanographic variability for extensive,
overlapping time periods. 1) Satellite data. Our sea
surface temperature (SST) image database provides 4-5
images/day, 1985 - today. These data define our study
period (1985-2006), allowing analysis of interannual
variability in SST and surface thermal patterns
indicative of circulation as time/space series within
each year. A shorter timeseries (1997-2004) of daily
SeaWiFS multispectral data supplement the SST data. 2)
Model fields. We will reconstruct major 3D hydrographic
structure and circulation in each study year using our
Gulf of Maine numerical model. Based on the 3D Princeton
Ocean Model, our hindcasts will use meteorological
forcing from the NCEP Eta reanalysis, river discharge,
assimilation of daily satellite SST fields and
climatological open ocean boundary conditions. 3) River
discharge and meteorological records in each study year
provide coincident ancillary data.
The overarching hypothesis that structures our
investigation is: Interannual differences in the
location, timing and magnitude of toxicity events along
the Maine coast are associated with interannual
variability in Gulf of Maine oceanographic patterns. We
will statistically isolate and quantify dominant
patterns in the multidimensional and gappy toxicity
record. A suite of metrics indicative of oceanographic
structure and forcing will be extracted from the image
time series, numerical model output fields and ancillary
data (e.g. dominant time/space SST variability,
location/strength of specific frontal zones,
timing/location of patterns indicative of specific
circulation, pycnocline depth, timing of stratification,
cross-shelf salinity structure, coherence of alongshore
currents, etc.). We then use correlation functions and
multivariate statistical tools to identify and quantify
those characteristics of Gulf of Maine oceanography most
consistently linked to toxicity events. We propose an
iterative system of analysis, basing initial approaches
on previous ECOHAB results and earlier analyses of
subsets of the toxicity record, modifying our metrics as
we learn which environmental parameters vary most
closely with toxicity timeseries.
Our results 1) simplify dominant patterns of variability
in the 22+ year toxicity record 2) identify those Gulf
of Maine environmental characteristics most closely
linked to toxic events 3) deliver a system of easily
monitored HAB ocean indices to managers and 4) point to
the most promising oceanic features upon which to focus
future, more physiologically, based research.
Results: The following interannual
metrics were calculated based on DMR shellfish toxicity
time series records for over 300 monitoring stations
throughout Maine (1985-2005):
| Metric Number |
Description |
| 1 |
Date of first toxicity event of the year. |
| 2 |
Temporal extent of annual toxicity |
| 3 |
Magnitude of annual toxicity (mean of
highest 3 values) |
| 4 |
Total toxicity over the year (annual
integral) |
| 5 |
Date of annual maximum in toxicity |
| 6 |
Presence
or absence of any toxicity in a year |
CLIMATOLOGIES:
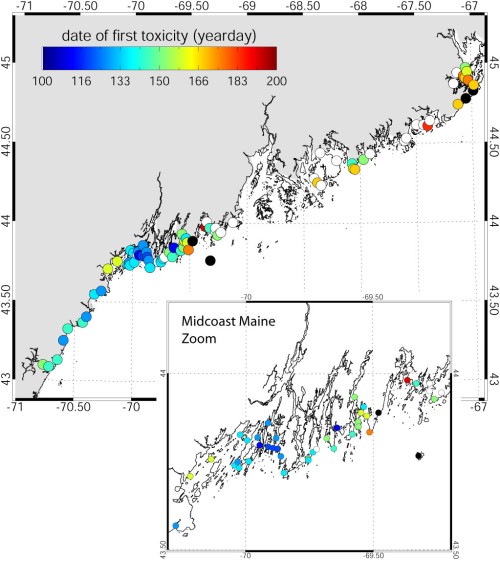
Figure 1: Climatological mean at each station of the date of first
toxicity (Metric 1).
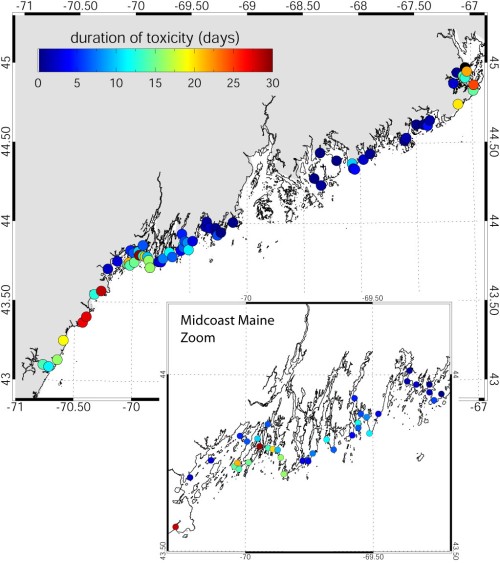
Figure 2: Climatological mean at each station of the
duration of toxic events (Metric 2).
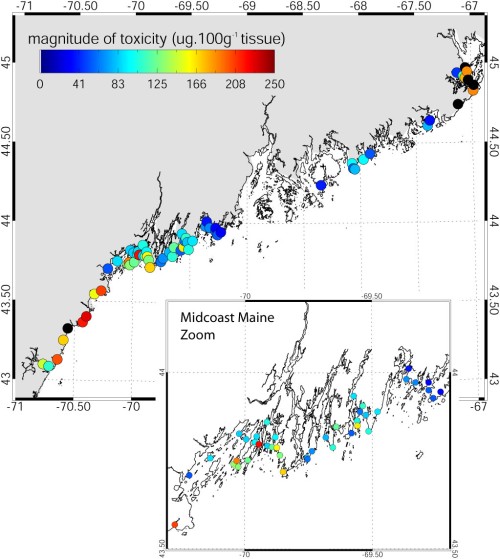
Figure 3: Climatological mean (geometric) at each
station of the magnitude of toxicity (Metric 3).
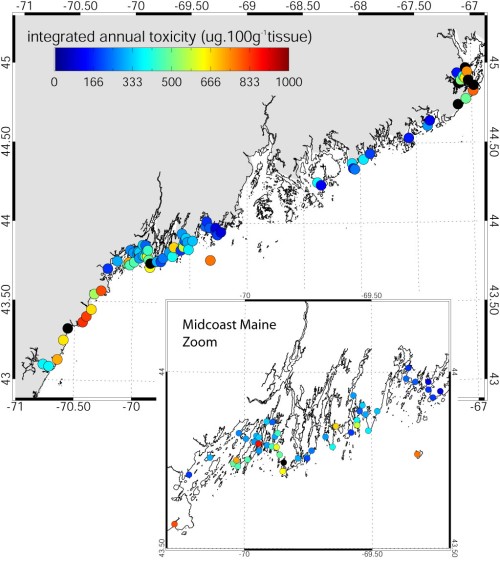
Figure 4: Climatological mean (geometric) at each
station of the integrated annual toxicity (Metric 4).
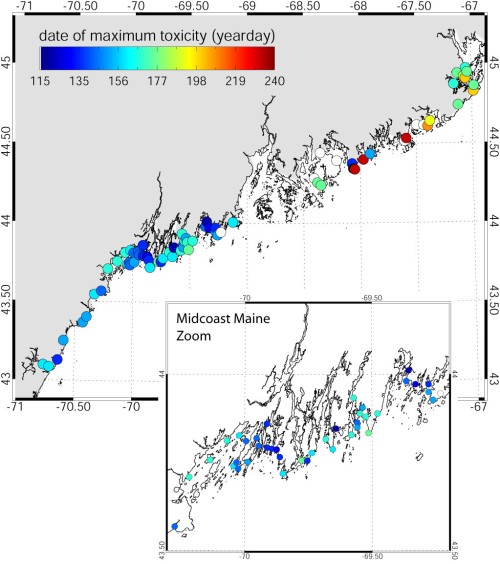
Figure 5: Climatological mean at each station of the
date of maximum toxicity (Metric 5).
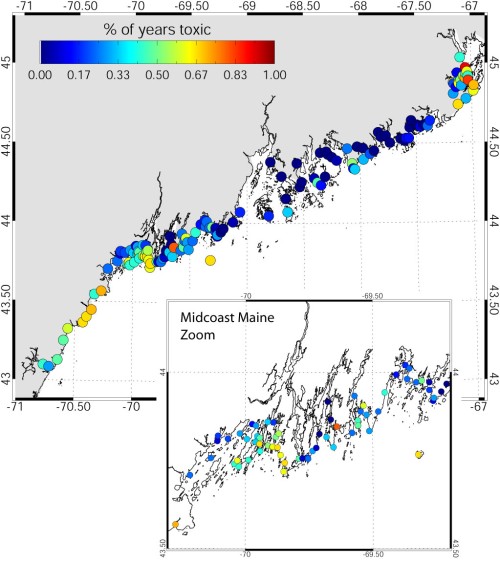
Figure 6: Percentage of years at each station that had
toxicity (Metric 6). MULTIVARIATE ANALYSIS
RESULTS (Station Clusters):
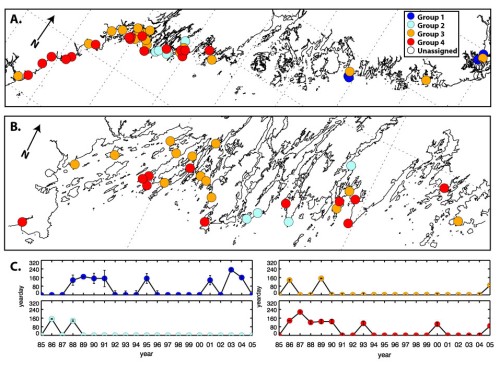
Figure 7:
Results of the multivariate analysis of station
similarity based on interannual variability in station
toxicity for Metric 1, date of the first toxicity event
of the year. Data shows locations of the stations and
their respective cluster membership (A) across the whole
study area, (B) the same data enlarged over the Casco
Bay / mid coast region of maximum station density, and
(C) the interannual variability over the study period
for each station cluster, as the mean within the member
stations each year. Whiskers on each annual mean are
standard errors.
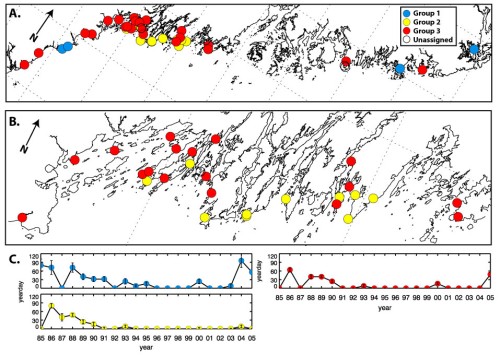
Figure 8:
The same as Figure 7, but for Metric 2, the temporal
extent of annual toxicity.
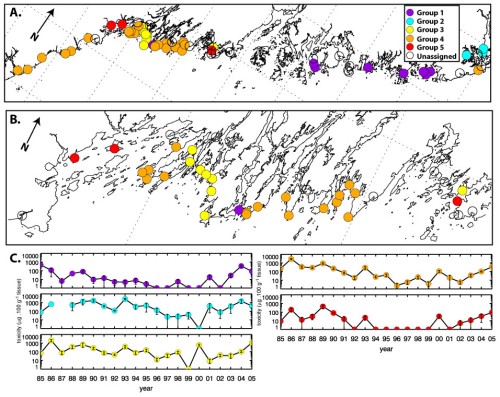
Figure 9:
The same as Figure 7, but for Metric 3, the maximum
annual toxicity.
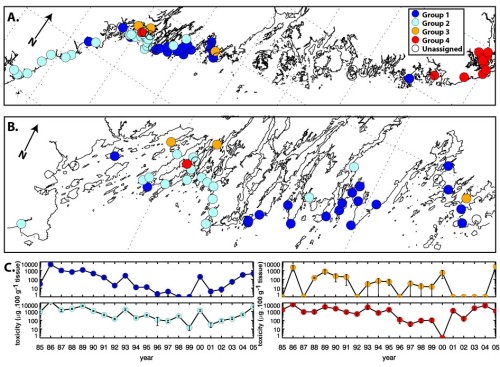
Figure 10:
The same as Figure 7, but for Metric 4, total toxicity
over the year (annual integral).
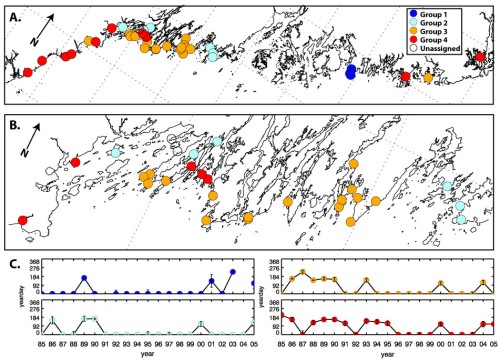
Figure 11:
same as Figure 7, but for Metric 5, date of annual
maximum in toxicity.
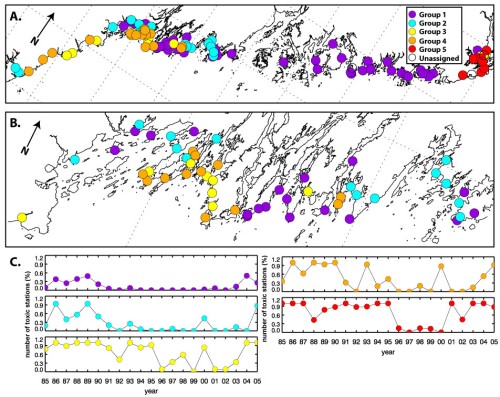
Figure 12:
The same as Figure 7, but for Metric 6, presence or
absence of any toxicity in a year (a binary metric). The
annual value for each cluster group (C) is calculated as
the percentage of member stations that are toxic in each
year.
MULTIVARIATE ANALYSIS RESULTS (Year
Clusters):
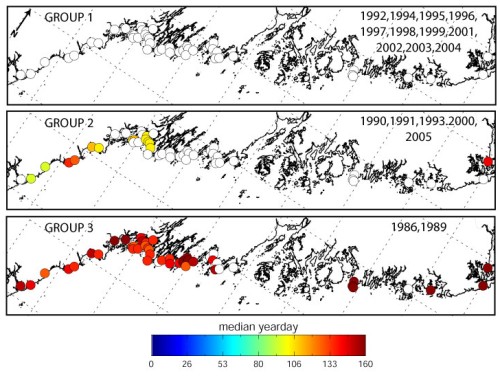
Figure 13:
Results of the multivariate analysis for year similarity
based on station toxicity for Metric 1, the date of
first toxicity. At each station, maps show the median
yearday of first toxicity within the years of each of
the 4 identified year-groups. White indicates a median
start day of 0, used to indicate no toxicity
development.
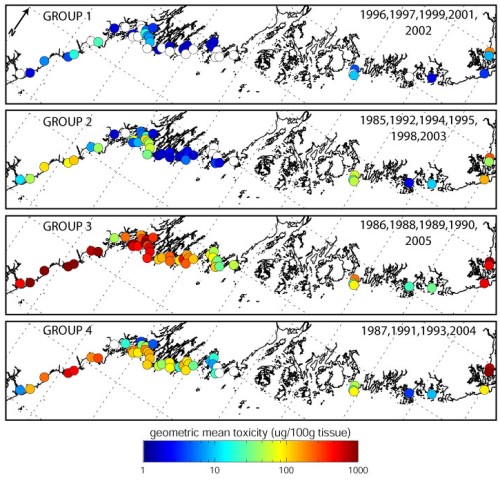
Figure 14:
The same as Figure 13, but for Metric 3, the magnitude
of maximum toxicity. Maps show the geometric mean of the
maximum toxicity values at each station within each of
the 4 clustered year-groups. White stations are those
for which the median over the years within the group is
zero.
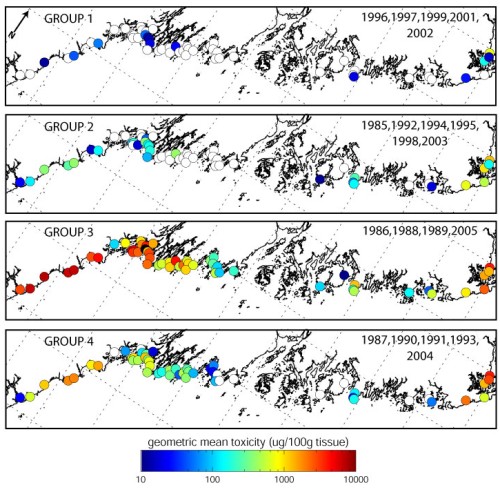
Figure 15:
The same as Figure 13, but for Metric 4, total
integrated toxicity over a year. Maps show the geometric
mean at each station over the years within each of the 4
identified year-groups. White stations are those with a
median of zero.
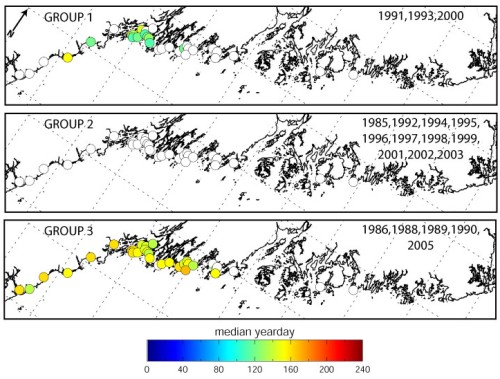
Figure 16:
The same as Figure 13, but for Metric 5, date of annual
maximum in toxicity. Maps show median yearday of the
toxicity maximum at each station across the years within
each of the 3 groups. White stations are those where the
median date was 0, indicating it did not become toxic.
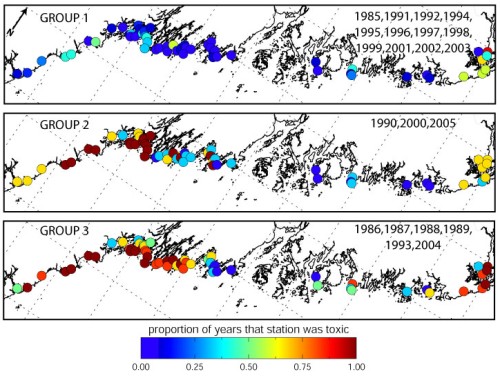
Figure 17:
The same as Figure 13, but for Metric 6, presence or
absence of any toxicity in a year (a binary metric).
Maps show the proportion of years within each group that
a station has toxicity, for each of the 3 identified
year-groups. |